Figure 3 script
Figure 3 script
To reproduce this figure, make sure you have downloaded all necessary input files (velocity maps and static terrain geometries) from https://doi.org/10.17605/OSF.IO/HE7YR and have updated the Vx and Vy columns in notebooks/manifest.csv with the downloaded file paths before starting the analysis.
import glaft
import pandas as pd
import matplotlib as mpl
from matplotlib.ticker import FormatStrFormatter
import matplotlib.pyplot as plt
import numpy as np
from cmcrameri import cm as cramericm
# font and linewidth settings
font = {'size'   : 14}
mpl.rc('font', **font)
axes_settings = {'linewidth'   : 2}
mpl.rc('axes', **axes_settings)

# read and select data
df = pd.read_csv('../manifest.csv', dtype=str)
in_shp = '/home/jovyan/Projects/PX_comparison/shapefiles/glacier_V1_Kaskawulsh_s_inwardBuffer600m.shp'
selected_cases = df.loc[[64, 79, 117]]
selected_cases
| Date | Duration (days) | Template size (px) | Template size (m) | Pixel spacing (px) | Pixel spacing (m) | Prefilter | Subpixel | Software | Vx | Vy | |
|---|---|---|---|---|---|---|---|---|---|---|---|
| 64 | LS8-20180802-20180818 | 16 | 64 | 960 | 1 | 15 | NAOF | 16-node oversampling | CARST | /home/jovyan/Projects/PX_comparison/PX/CARST/2... | /home/jovyan/Projects/PX_comparison/PX/CARST/2... |
| 79 | LS8-20180802-20180818 | 16 | varying: multi-pass | varying: multi-pass | 4.009 | 60.14 | NAOF | interest point groups | GIV | /home/jovyan/Projects/PX_comparison/PX/GIV/u_l... | /home/jovyan/Projects/PX_comparison/PX/GIV/v_l... |
| 117 | LS8-20180802-20180818 | 16 | 31 | 465 | 1 | 15 | LoG | affine | Vmap | /home/jovyan/Projects/PX_comparison/PX/Vmap/su... | /home/jovyan/Projects/PX_comparison/PX/Vmap/su... |
This cell performs the static terrain analysis and calculates the corresponding metrics.
exps = {}

for idx, row in selected_cases.iterrows():
    exp = glaft.Velocity(vxfile=row.Vx, vyfile=row.Vy, on_ice_area=in_shp, kde_gridsize=60, thres_sigma=2.0)
    exp.longitudinal_shear_analysis()
    exps[idx] = exp
The following functions plot the braces on the axes with annotations, which is necessary for Figure 3. They are modified from guzey’s answer to this StackOverflow thread.
def draw_brace_x(ax, xspan: tuple=(None, None), yy: float=0.0, text: str=''):
    """
    ax: axes to be drawn.
    xspan: x coordinates of the two brace ending points.
    yy: y coordinate of the two brace ending points.
        (The brace will be placed horizontally)
    text: annotation text.
    """

    xmin, xmax = xspan
    xspan = xmax - xmin
    ax_xmin, ax_xmax = ax.get_xlim()
    xax_span = ax_xmax - ax_xmin

    ymin, ymax = ax.get_ylim()
    yspan = ymax - ymin
    resolution = int(xspan / xax_span * 100) * 2 + 1 # sampling resolution of the sigmoid brace
    beta = 200. / xax_span                           # the higher this is, the sharper the sigmoid

    x = np.linspace(xmin, xmax, resolution)
    x_half = x[:int(resolution / 2) + 1]
    y_half_brace = (1 / (1. + np.exp(-beta * (x_half - x_half[0] )))
                  + 1 / (1. + np.exp(-beta * (x_half - x_half[-1]))))
    y = np.concatenate((y_half_brace, y_half_brace[-2::-1]))
    y = yy - (.05 * y - .01) * yspan                 # adjust vertical stretch and position

    ax.plot(x, y, color='black', lw=1)
    ax.text((xmax + xmin) / 2., yy - .07 * yspan, text, ha='left', va='top')

def draw_brace_y(ax, yspan: tuple=(None, None), xx: float=0.0, text: str=''):
    """
    ax: axes to be drawn.
    yspan: y coordinates of the two brace ending points.
    xx: x coordinate of the two brace ending points.
        (The brace will be placed vertically)
    text: annotation text.
    """

    ymin, ymax = yspan
    yspan = ymax - ymin
    ax_ymin, ax_ymax = ax.get_ylim()
    yax_span = ax_ymax - ax_ymin

    xmin, xmax = ax.get_xlim()
    xspan = xmax - xmin
    resolution = int(yspan / yax_span * 100) * 2 + 1 # sampling resolution of the sigmoid brace
    beta = 200. / yax_span                           # the higher this is, the sharper the sigmoid

    y = np.linspace(ymin, ymax, resolution)
    y_half = y[:int(resolution / 2) + 1]
    x_half_brace = (1 / (1. + np.exp(-beta * (y_half - y_half[0] )))
                  + 1 / (1. + np.exp(-beta * (y_half - y_half[-1]))))
    x = np.concatenate((x_half_brace, x_half_brace[-2::-1]))
    x = xx - (.05 * x - .01) * xspan                 # adjust vertical stretch and position

    ax.plot(x, y, color='black', lw=1)
    ax.text(xx - .05 * xspan, (ymax + ymin) / 2., text, rotation=90, ha='right', va='bottom')
Now starting to make the figure:
# vmax = exps[117].metric_alongflow_normal
vmax = 0.03
fig = plt.figure(figsize=(13, 9.5))
subfigs = fig.subfigures(1, 4, wspace=0, hspace=0, width_ratios=(0.3, 0.3, 0.3, 0.1)) # last column is for colorbar
all_axs = np.empty(4, dtype='object')
# create three subplots in each subfigure
for i, subfig in enumerate(subfigs[:3]):
all_axs[i] = subfig.subplots(3, 1, gridspec_kw = {'hspace':0, 'height_ratios':(0.28377, 0.28377, 0.43246)})
# a = 0.3962, b = 0.6038 (from Figure 2)
# x = a/(2a + b) = 0.28377
# y = b/(2a + b) = 0.43246
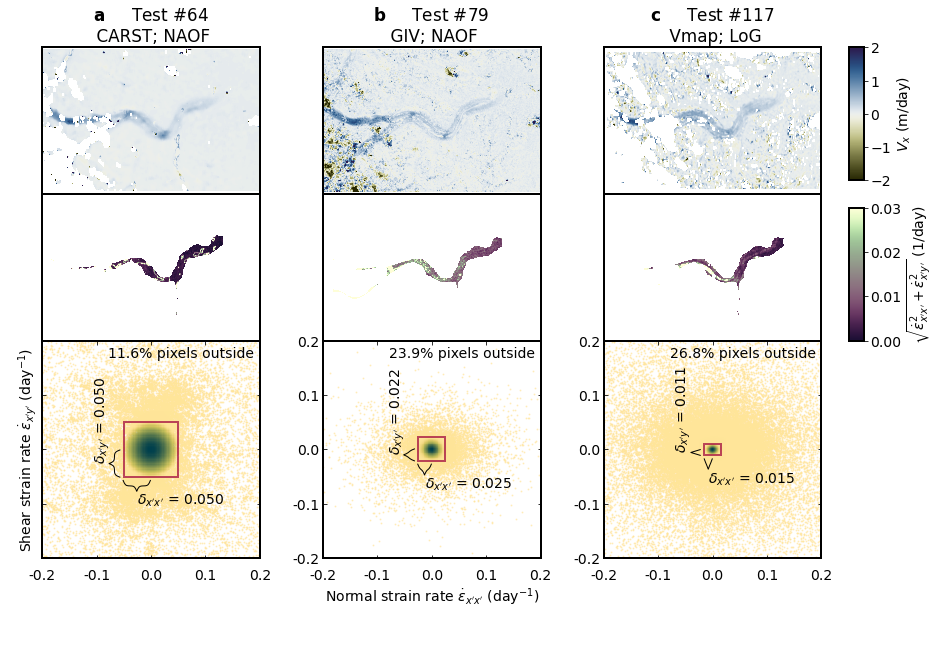
title_labels = np.array(['$\mathbf{a}$ \t Test #64 \n CARST; NAOF',
'$\mathbf{b}$ \t Test #79 \n GIV; NAOF',
'$\mathbf{c}$ \t Test #117 \n Vmap; LoG'])
for idx, i in [[64, 0], [79, 1], [117, 2]]:
exp = exps[idx]
# top panel
ax_sel = all_axs[i][0]
cm_settings = glaft.show_velocomp(exp.vxfile, ax=ax_sel)
ax_sel.set_aspect('equal', adjustable='datalim')
ax_sel.set_title(title_labels[i])
# middle panel
ax_sel = all_axs[i][1]
mappable_strain = exp.plot_strain_map(ax=ax_sel, vmax=vmax, base_colormap=cramericm.tokyo)
ax_sel.set_aspect('equal', adjustable='datalim')
# bottom panel
ax_sel = all_axs[i][2]
exp.plot_zoomed_extent(metric=2, ax=ax_sel)
ax_sel.set_aspect('equal', adjustable='box')
ax_sel.set_xlim(-0.2, 0.2)
ax_sel.set_ylim(-0.2, 0.2)
ax_sel.set_title(None)
# bottom panel ticks
ax_sel.tick_params(direction="in", bottom=True, top=True, left=True, right=True)
ax_sel.tick_params(axis='x', pad=10)
ax_sel.yaxis.set_major_formatter(FormatStrFormatter('%.1f'))
ax_sel.xaxis.set_major_formatter(FormatStrFormatter('%.1f'))
ax_sel.set_yticks([-0.2, -0.1, 0.0, 0.1, 0.2])
ax_sel.set_xticks([-0.2, -0.1, 0.0, 0.1, 0.2])
# show percentage of pixels outside
ax_sel.text(0.19, 0.19, '{:.1f}% pixels outside'.format(exp.outlier_percent * 100), ha='right', va='top')
# annotations of du and dv
draw_brace_x(ax_sel,
xspan=(exp.kdepeak_x - exp.metric_alongflow_normal, exp.kdepeak_x),
yy=exp.kdepeak_y - exp.metric_alongflow_shear,
text="$\delta_{x'x'}$" + " = {:.3f}".format(exp.metric_alongflow_normal))
draw_brace_y(ax_sel,
yspan=(exp.kdepeak_y - exp.metric_alongflow_shear, exp.kdepeak_y),
xx=exp.kdepeak_x - exp.metric_alongflow_normal,
text="$\delta_{x'y'}$" + " = {:.3f}".format(exp.metric_alongflow_shear))
# fine-tune positions of the top panels
# x0 = left, x1 = right, y0 = bottom, y1 = top
bbox_top = all_axs[0][0].get_position()
bbox_middle = all_axs[0][1].get_position()
bbox_bottom = all_axs[0][2].get_position()
bbox_bottom_vertical_shift = bbox_middle.y0 - bbox_bottom.y1
bbox_bottom.y0 = bbox_bottom.y0 + bbox_bottom_vertical_shift
bbox_bottom.y1 = bbox_bottom.y1 + bbox_bottom_vertical_shift
for i, subfig in enumerate(all_axs[:3]):
all_axs[i][2].set_position(bbox_bottom)
# add colorbars
mappable_velo = glaft.prep_colorbar_mappable(**cm_settings)
cax = subfigs[3].add_axes([0.0, bbox_top.y0 + 0.02, 0.15, bbox_top.y1 - bbox_top.y0 - 0.02])
subfigs[3].colorbar(mappable_velo, cax=cax, orientation='vertical', label='$V_x$ ({})'.format(exp.velocity_unit), ticks=[-2, -1, 0, 1, 2])
cax2 = subfigs[3].add_axes([0.0, bbox_middle.y0, 0.15, bbox_middle.y1 - bbox_middle.y0 - 0.02])
strain_cmap_label = "$\sqrt{\dot{\epsilon}_{x'x'}^2 + \dot{\epsilon}_{x'y'}^2}$ (1/day)"
subfigs[3].colorbar(mappable_strain, cax=cax2, orientation='vertical', label=strain_cmap_label, ticks=[0, 0.01, 0.02, 0.03])
# add axis labels
all_axs[0][2].set_yticklabels(['', '', '', '', '']) # to prevent label bleeding
all_axs[0][2].set_ylabel("Shear strain rate $\dot{\epsilon}_{x'y'}$ (day$^{-1}$)", labelpad=-0.0) # ditto
all_axs[1][2].set_xlabel("Normal strain rate $\dot{\epsilon}_{x'x'}$ (day$^{-1}$)")
# save figure
fig.patch.set_facecolor('xkcd:white')
fig.savefig('Fig3.png', dpi=200)