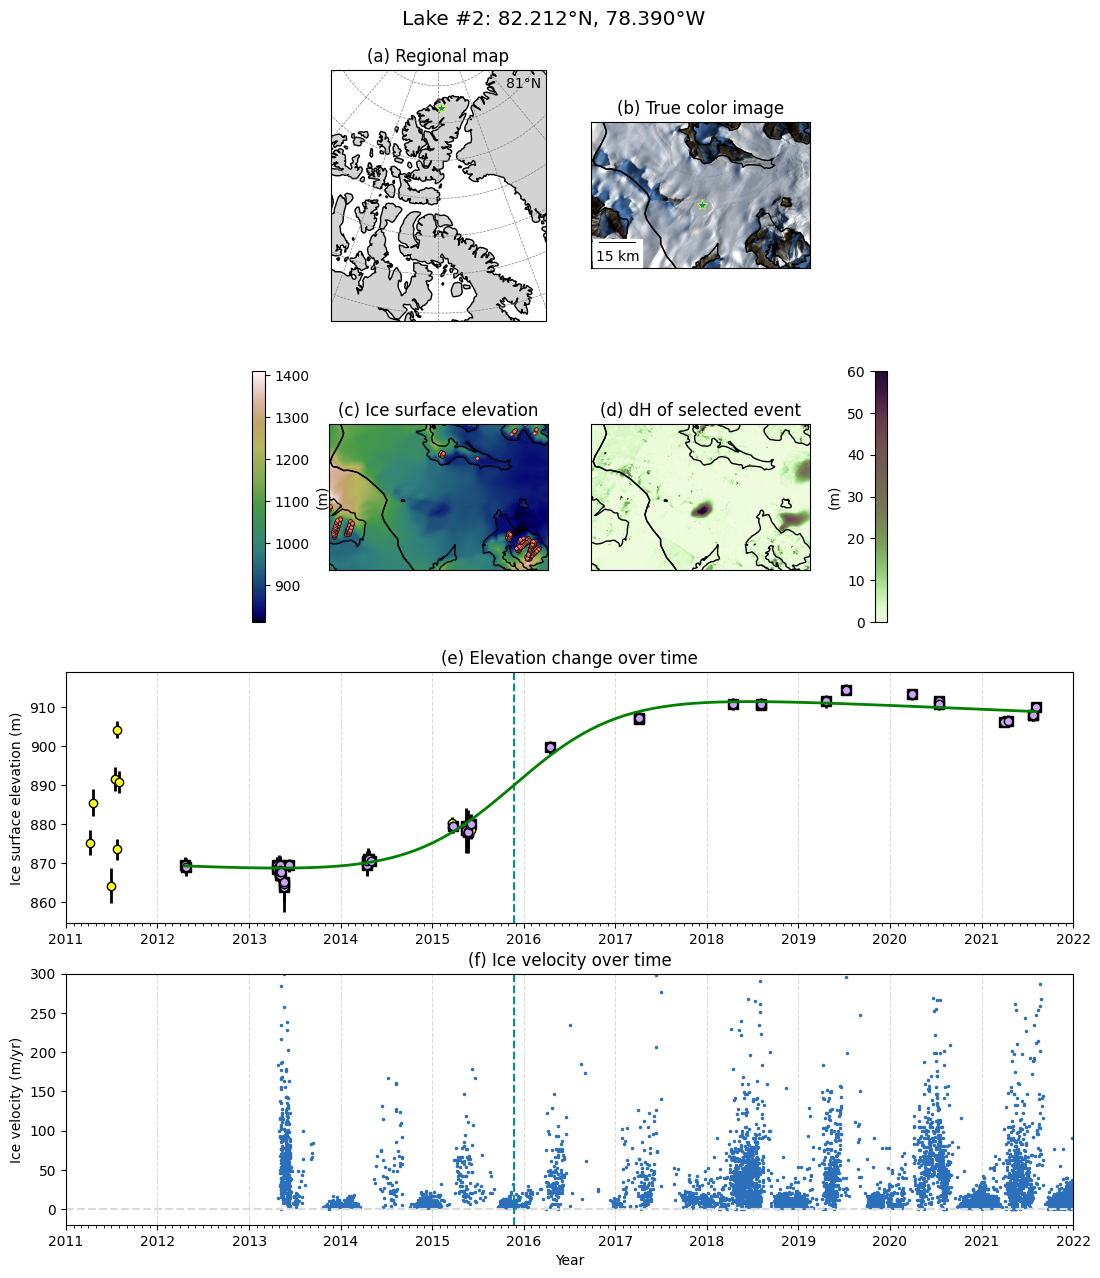
Supplementary figure script: Sigmoid model (recharge)#
This example script generates Figure S2.
%load_ext autoreload
%autoreload 2
import sys
sys.path.append('/home/whyjz278/Github/ac-subglacial-lakes')
import numpy as np
from carst.libdhdt import sigmoid_reg as smr
from carst.libdhdt import DemPile
from datetime import datetime, timedelta
import rasterio
from rasterio.plot import show as rioshow
import matplotlib.pyplot as plt
import matplotlib.dates as mdates
import matplotlib.ticker as tkr
import matplotlib.gridspec as gridspec
from matplotlib_scalebar.scalebar import ScaleBar
from pyproj import Transformer
from cmcrameri import cm
import achydro
import cartopy.crs as ccrs
import cartopy.feature as cfeature
import itslive


# ======================================
# Settings that need to change
tag = 'Milne'
tagno = 2
final_output_tag = 'hydroevent-evmd-bitmask'
rgi_index = '../../RGI2000-v7.0-G-03_arctic_canada_north.zip'

row, col = (228, 302)
evmd_threshold = 20
min_samples = 3
k_bounds = [5, 150]

# ======================================
# Settings that do not need to change
sentinel_tif_path = f"../../_optical/Lake{tagno:02d}_EPSG3413.tif"  # Replace with your file path
working_epsg = 3413
carst_inipath = f'../../{tag}/defaults.ini'
selected_elev_file = f'../../{tag}/ref_elevs.csv'
refdate = datetime(2015, 1, 1)

pile = DemPile()
pile.read_config(carst_inipath)
pile.picklepath = f'../../{tag}/{pile.picklepath}'
pile.dhdtprefix = f'../../{tag}/{pile.dhdtprefix}'
pile.load_pickle()

gdf_rgi = achydro.read_zipped_shapefile(rgi_index, working_epsg)
ref_h = np.loadtxt(selected_elev_file, skiprows=1, delimiter=",")
def get_rgb_image(tif_path):

    def stretch(img):
        vmin, vmax = np.nanpercentile(img, (2, 98))
        return np.clip((img - vmin) / (vmax - vmin), 0, 1)

    with rasterio.open(sentinel_tif_path) as src:

        # Read bands
        red = src.read(1)
        green = src.read(2)
        blue = src.read(3)

        # Stretch
        red = stretch(red)
        green = stretch(green)
        blue = stretch(blue)

        # Stack into a (H, W, 3) RGB image
        rgb = np.dstack((red, green, blue))

        # Get bounding box (world coordinates)
        transform = src.transform
        xmin, ymax = transform * (0, 0)  # Top-left corner
        xmax, ymin = transform * (src.width, src.height)  # Bottom-right corner
        extent = [xmin, xmax, ymin, ymax]

    return rgb, extent

rgb, extent = get_rgb_image(sentinel_tif_path)
def get_topo(pile):
    quick_topography_path = f'{pile.dhdtprefix}_median_topo.tif'
    with rasterio.open(quick_topography_path) as toporaster:
        topo = toporaster.read(1)
        left, bottom, right, top = toporaster.bounds
        img_extent = (left, right, bottom, top)

    return topo, img_extent

def get_water_dh(pile):
    water_dh_path = f'{pile.dhdtprefix}_{final_output_tag}_dh.tif'
    with rasterio.open(water_dh_path) as water_dhraster:
        water_dh = water_dhraster.read(1)

    return water_dh


topo, img_extent = get_topo(pile)
water_dh = get_water_dh(pile)
def dh_regression(pile, row, col, evmd_threshold, min_samples, k_bounds, img_extent):

    exitstate, evmd_lbl = pile.ts[row, col].do_evmd(eps=evmd_threshold, min_samples=min_samples)
    bitmask_lbl = pile.ts[row, col].bitmask_labels
    good_idx = np.logical_and(bitmask_lbl == 0, evmd_lbl >= 0)
    arr = pile.ts[row, col]
    x = arr.get_date()
    y = arr.get_value()
    ye = arr.get_uncertainty()
    x_date = np.array([pile.refdate + timedelta(days=i) for i in x])

    left, right, bottom, top = img_extent
    sampleloc_x = (col / pile.ts.shape[1]) * (right - left) + left
    sampleloc_y = top - (row / pile.ts.shape[0]) * (top - bottom)

    x_good = x[good_idx]
    y_good = y[good_idx]
    ye_good = ye[good_idx]

    x_pred, y_pred, sigmoid_height, sigmoid_height_stderr, sigmoid_timing, exitstate = smr(x_good, y_good, ye=ye_good, k_bounds=k_bounds, downward_first=False)
    event_time = refdate + timedelta(days=sigmoid_timing)

    x_pred_date = [pile.refdate + timedelta(days=i) for i in x_pred]
    x_good_date = [pile.refdate + timedelta(days=i) for i in x_good]

    transformer = Transformer.from_crs("EPSG:3413", "EPSG:4326", always_xy=True)
    sampleloc_lon, sampleloc_lat = transformer.transform(sampleloc_x, sampleloc_y)

    lakepos_xy = (sampleloc_x, sampleloc_y)
    lakepos_lonlat = (sampleloc_lon, sampleloc_lat)

    return bitmask_lbl, x_date, y, ye, x_pred_date, y_pred, x_good_date, y_good, event_time, lakepos_xy, lakepos_lonlat


bitmask_lbl, x_date, y, ye, x_pred_date, y_pred, x_good_date, y_good, event_time, lakepos_xy, lakepos_lonlat = dh_regression(
    pile, row, col, evmd_threshold, min_samples, k_bounds, img_extent)

# print((sampleloc_lon, sampleloc_lat))
velocity = itslive.velocity_cubes.get_time_series(points=[lakepos_lonlat])
def plot_canadian_arctic(ax, lakepos_lonlat):

    ax.set_extent([-100, -60, 65, 85], ccrs.PlateCarree())

    # Add coastline features with increased resolution (for better detail)
    ax.add_feature(cfeature.COASTLINE.with_scale('50m'), linewidth=1.0, edgecolor='black')

    # Add land and ocean features for visual context
    ax.add_feature(cfeature.LAND.with_scale('50m'), facecolor='lightgray')

    # Add gridlines for reference
    gl = ax.gridlines(draw_labels=True, linewidth=0.5, linestyle='--', color='gray')
    gl.top_labels = False
    gl.bottom_labels = False
    gl.right_labels = False
    gl.left_labels = False

    ax.plot(lakepos_lonlat[0], lakepos_lonlat[1], '*', transform=ccrs.PlateCarree(),
            markersize=8, markeredgewidth=0.5, markeredgecolor='xkcd:yellow', color='xkcd:teal')

    # Add title
    ax.set_title('(a) Regional map')  # , fontsize=14)
def plot_rgbimage(ax, rgb, extent, gdf_rgi, lakepos_xy):
    ax.imshow(rgb, extent=extent)
    gdf_rgi.plot(ax=ax, facecolor='none', edgecolor='xkcd:black', linewidth=1)

    ax.set_xticks([])
    ax.set_yticks([])

    ax.plot(lakepos_xy[0], lakepos_xy[1], '*',
            markersize=8, markeredgewidth=0.5, markeredgecolor='xkcd:yellow', color='xkcd:teal')

    # Add scalebar (assuming your coordinates are in meters)
    pixel_size = (extent[1] - extent[0]) / rgb.shape[1]  # meters per pixel
    scalebar = ScaleBar(pixel_size, 'm', location='lower left')
    ax.add_artist(scalebar)

    ax.set_title('(b) True color image')
def m2km_fmt(x, pos): # custom formatter function
    s = f'{x / 1000}'
    return s
def plot_topo(ax, topo, img_extent, gdf_rgi, ref_h):

    h_im = ax.imshow(topo, extent=img_extent, cmap='gist_earth')

    ax.plot(ref_h[:, 0], ref_h[:, 1], 'o', color='xkcd:salmon', markersize=2.5, markeredgecolor='xkcd:black', markeredgewidth=0.3)
    gdf_rgi.plot(ax=ax, facecolor='none', edgecolor='xkcd:black', linewidth=1)

    # ax.plot(sampleloc_x, sampleloc_y, '*', markersize=7, markeredgewidth=0.3, markeredgecolor='xkcd:black', color='xkcd:violet')
    left, right, bottom, top = img_extent
    ax.set_xlim(left, right)
    ax.set_ylim(bottom, top)
    tick_fmt = tkr.FuncFormatter(m2km_fmt)
    ax.xaxis.set_major_formatter(tick_fmt)
    ax.yaxis.set_major_formatter(tick_fmt)
    # ax.set_xlabel('EPSG:3413 coordinates (km)')
    # ax.set_ylabel('EPSG:3413 coordinates (km)')
    ax.set_title('(c) Ice surface elevation')

    return img_extent, h_im
def plot_dh(ax, water_dh, img_extent, gdf_rgi):

    dh_im = ax.imshow(water_dh, extent=img_extent, cmap=cm.tokyo_r, clim=(0, 60))
    gdf_rgi.plot(ax=ax, facecolor='none', edgecolor='xkcd:black', linewidth=1)
    # ax.plot(sampleloc_x, sampleloc_y, '*', markersize=7, markeredgewidth=0.3, markeredgecolor='xkcd:black', color='xkcd:violet')
    ax.set_title('(d) dH of selected event')

    return dh_im
def plot_regression(ax, bitmask_lbl, x_date, y, ye, x_pred_date, y_pred, x_good_date, y_good, event_time):
    # ax.set_title(f'Sigmoid height (2-sigma) = {sigmoid_height:.2f}±{2 * sigmoid_height_stderr:.2f} m' )
    ax.errorbar(x_date, y, yerr=ye * 2, linewidth=2, fmt='k.')
    ax.plot(x_pred_date, y_pred, color='g', linewidth=2, zorder=20)

    ax.plot(x_good_date, y_good, 's', color='k', markersize=7, zorder=5)
    # event_time = refdate + timedelta(days=sigmoid_timing)
    # if not np.isnan(sigmoid_timing):
    ax.axvline(event_time, linestyle='--', color='xkcd:teal')


    # bitmask_colorcodes = ['xkcd:lilac', 'xkcd:gray', 'xkcd:light blue',  'xkcd:blue',
    #                       'xkcd:light yellow',  'xkcd:yellow', 'xkcd:gold', 'xkcd:brown']
    # bitmask_comments = ['Good', 'Edge', 'Water', 'Water+Edge',
    #                     'Cloud', 'Cloud+Edge', 'Cloud+Water', 'Cloud+Edge+Water']
    # for selected_bit, colorcode in zip([0, 1, 2, 3, 4, 5, 6, 7], bitmask_colorcodes):
    #     selected_group_index = bitmask_lbl == selected_bit
    #     ax.plot(x_date[selected_group_index], y[selected_group_index], '.', color=colorcode,
    #                 markersize=12, markeredgewidth=1, markeredgecolor='k', zorder=selected_bit + 10)
    ax.plot(x_date, y,           '.', color='xkcd:yellow', markersize=12, markeredgewidth=1, markeredgecolor='k', zorder=14)
    ax.plot(x_good_date, y_good, '.', color='xkcd:lilac',  markersize=12, markeredgewidth=1, markeredgecolor='k', zorder=15)

    # plt.setp(ax.get_xticklabels(), rotation=-30, ha='left')
    ax.set_xlim(datetime(2010, 1, 1), datetime(2024, 1, 1))
    ax.grid(axis='x', linestyle='--', color='xkcd:light grey')
    # ax.set_xlabel('pixel location = [{}, {}]'.format(row, col))
    ax.set_title('(e) Elevation change over time')
    ax.set_ylabel('Ice surface elevation (m)')
def plot_itslive(ax, event_time):

    latitude = velocity[0]["requested_point_geographic_coordinates"][1]
    longitude = velocity[0]["requested_point_geographic_coordinates"][0]


    point_label = f"Lon: {longitude}, Lat: {latitude}"
    velocity[0]["time_series"].v.plot(ax=ax,
                              linestyle="None",
                              marker="o",
                              markersize=1.5,
                              c='xkcd:medium blue',
                              label=point_label,
                              add_legend=True)

    ax.xaxis.set_major_locator(mdates.YearLocator())
    ax.xaxis.set_minor_locator(mdates.MonthLocator())
    ax.set_xlim(datetime(2011, 1, 1), datetime(2022, 1, 1))
    ax.set_ylim(-20, 300)
    ax.grid(axis='x', linestyle='--', color='xkcd:light grey')
    ax.axhline(0, linestyle='--', color='xkcd:light grey')
    ax.axvline(event_time, linestyle='--', color='xkcd:teal')
    ax.set_xlabel("Year")
    ax.set_ylabel('Ice velocity (m/yr)')
    ax.set_title('(f) Ice velocity over time')
fig = plt.figure(figsize=(13, 15), layout='constrained')

# Panel partition
gs = gridspec.GridSpec(4, 4) # , height_ratios=[1, 1, 0.5, 0.5])

# Set all axes
ax1 = fig.add_subplot(gs[0, 1], projection=ccrs.NorthPolarStereo(central_longitude=-80))
ax3 = fig.add_subplot(gs[1, 1])
ax4 = fig.add_subplot(gs[1, 2], sharex=ax3, sharey=ax3)
ax2 = fig.add_subplot(gs[0, 2], sharex=ax3, sharey=ax3)
axbottom1 = fig.add_subplot(gs[2, :])
axbottom2 = fig.add_subplot(gs[3, :], sharex=axbottom1)

ax3side = fig.add_subplot(gs[1, 0])
ax4side = fig.add_subplot(gs[1, 3])

# Plot
plot_canadian_arctic(ax1, lakepos_lonlat)
plot_rgbimage(ax2, rgb, extent, gdf_rgi, lakepos_xy)

img_extent, h_im = plot_topo(ax3, topo, img_extent, gdf_rgi, ref_h)
dh_im = plot_dh(ax4, water_dh, img_extent, gdf_rgi)

cbar1 = fig.colorbar(h_im, ax=ax3side) #, location='right', pad=0.1)
cbar2 = fig.colorbar(dh_im, ax=ax4side, location='left')
cbar1.ax.set_ylabel('(m)')
cbar2.ax.set_ylabel('(m)')
ax3side.remove()
ax4side.remove()

plot_regression(axbottom1, bitmask_lbl, x_date, y, ye, x_pred_date, y_pred, x_good_date, y_good, event_time)
plot_itslive(axbottom2, event_time)

# Customization area
# axbottom1.set_ylim(440, 520)
# axbottom2.set_ylim(-20, 400)

fig.suptitle(f'Lake #{tagno}: {lakepos_lonlat[1]:.3f}°N, {abs(lakepos_lonlat[0]):.3f}°W', y=0.92, fontsize="x-large")
# fig.subplots_adjust(top=0.95)
fig.patch.set_facecolor('xkcd:white')
fig.savefig(f'{tagno:02d}_{tag}_{final_output_tag}_viz.png', bbox_inches='tight', pad_inches=0.3)