Title (Replace it with your project title)#
Whyjay Zheng, John Doe, & John Smith
Abstract#
Abstract text (<100 words).
Main#
Introduction#
Introduction content. No code blocks allowed in this section. To cite other work, please use formats like “(Banks et al., 2019)” or “Banks et al. (2019) mentioned…”. You must specify permission when using copyright-protected material, including figures, text, tables, etc.
sub-heading of introduction#
Feel free to divide the introduction section as you like.
sub-sub-heading of introduction#
Something here.
sub-heading of introduction 2#
In-line Latex math: \(\hat{\textbf{a}}=(\textbf{X}^\text{T}\textbf{X}+\lambda \textbf{I})^{-1}\textbf{X}^\text{T}\textbf{y}\)
Latex math block:
Inserting a figure:
![]()
Figure 1. CSRSR logo.
Results#
Your results. No code blocks allowed in this section. Figures and tables are allowed. You should provide a caption to each figure and table.
Making a table:
Table 1. Something about the results.
Label |
Model |
RMSE |
|---|---|---|
Wish |
Linear (Ridge) |
0.716 |
Hibana |
Random Forest |
0.384 |
sub-heading of results#
Feel free to divide this section as you like.
Discussion#
Discussion. No code blocks allowed in this section.
sub-heading of discussion#
Feel free to divide this section as you like.
Conclusions#
One paragraph concluding your work.
Methods#
Describe the data and methods used in the project. Code blocks are allowed and recommended.
Although not necessary, I recommend uploading the raw or processed data to a location that can be accessed directly (e.g., GitHub) to facilitate easy reproduction of the work.
# Sample code cell
# Import modules
import numpy as np
from scipy.linalg import lstsq
import matplotlib.pyplot as plt
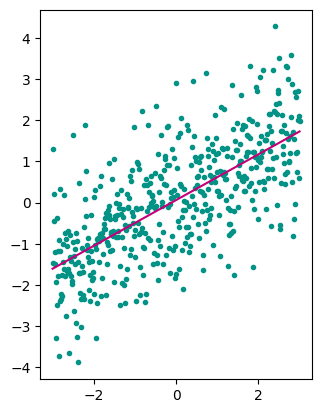
# Generate/Import data
x = np.linspace(-3, 3, 500)
y = 0.5 * x + np.random.randn(500)
# Analysis
X = x[:, np.newaxis]**[0, 1]
a, _, _, _ = lstsq(X, y)
print(f'Model: y = {a[0]:.2f} + {a[1]:.2f}x')
# Visualization
plt.plot(x, y, '.', color='xkcd:teal')
plt.plot(x, np.polyval(np.flip(a), x), color='xkcd:magenta')
plt.gca().set_aspect('equal', 'box');
# I ddded a semicolon in the end of the last line
# to prevent unnecessary output print.
Model: y = 0.06 + 0.56x
sub-heading of methods#
Feel free to divide the method section as you like.
References#
Banks, G. C., et al. (2019). Answers to 18 Questions About Open Science Practices. Journal of Business and Psychology, 34(3), 257–270. https://doi.org/10.1007/s10869-018-9547-8 | Full text available on ResearchGate (accessed on February 16, 2023)
Piller, C. (2022). Blots on a field? Science, 377(6604), 358–363. https://doi.org/10.1126/science.add9993