Assistant Professor
National Central University (Taiwan), Center for Space and Remote Sensing Research
I am interested in processes that shape a planet's surface and how remote sensing techniques help understand them better. My recent work focuses on glacier physics and cryospheric changes under the context of global warming. I am also keen to improve the efficiency and lower the threshold for conducting research in geoscience, which is essential since the data coming from remote sensing observations are getting larger and larger.
I work with multiple science teams for processing high-resolution satellite data sets, such as optical, SAR, multi-spectral, and altimetry. We develop algorithms for fast, interactive, and robust Earth science workflows. I joined the Jupyter Meets the Earth project team in 2021 with two main goals: (1) facilitating exploratory and interactive Earth science analysis at scale; and (2) adopting physics-based statistical learning approaches for understanding the driving mechanisms of the accelerated land ice loss.
My background is in geophysics, planetary science, and remote sensing. My other non-glacier research projects include feature tracking of volcanic deformation, earthquake studies using InSAR, and the ice flexure model of Saturn's satellite Iapetus.
National Central University (Taiwan), Center for Space and Remote Sensing Research
University of California Berkeley, Department of Statistics
University of Washington (online program). Project Lead
Cornell University, Department of Earth and Atmospheric Sciences
McCarthy, Alaska; organized by the University of Alaska, Fairbanks (UAF)
National Taiwan University, Geophysical Analysis Lab, Institute of Oceanography
National Taiwan University, Geo 1008: "Introduction to Field Geology (II)"
High-school level to first-year college
Ph.D. in Geological Sciences
minor concentration: Planetary Sciences
Supervisor: Matt Pritchard
Cornell University, USA
Master of Science in Geosciences
Co-Supervisors: Wing-Huen Ip and Louis S. Teng
National Taiwan University, Taiwan
Bachelor of Science in Geosciences
National Taiwan University, Taiwan


PhD Dissertation: INVESTIGATING MASS LOSS AND CHANGING ICE DYNAMICS OF ARCTIC ICE CAPS USING REMOTE SENSING
Glacier thinning and retreat have accelerated globally in the last century and are the largest contributor to rising sea levels. For the Arctic region, observations and modeling results have shown that extensive warming is taking place. However, the recent glacier dynamics (mass balance and ice discharge) in many Arctic regions have not been well studied due to the remote nature of these glaciers. This thesis uses multiple types of satellite data to quantify the mass balance and ice discharge for three Arctic regions showing dramatic glacier change in recent decades possibly due to Arctic warming. The objective is to resolve the mass budget and velocity pattern on a per glacier basis and understand the mechanisms driving recent changes. To facilitate the entire workflow, our research team has developed the Cryosphere and Remote Sensing Toolkit (CARST) software, and I am the lead author. CARST provides useful python and bash scripts that use satellite imagery, particularly SAR and optical images, to monitor changes of glaciers and ice caps through time. The first study area is Franz Josef Land (FJL), Russia, which is currently subjected to a rapidly-warming climate in the Arctic. I combine surface elevation data derived from different sources and times, including the WorldView satellite series and the ArcticDEM data set (2011–2015), SPOT-5 (2007), CryoSat-2 (2011–2015), and a digitized cartographic map (1953). I calculate elevation change rate (dh/dt) in two different periods, and the results show a two-fold rate of ice loss over the past 60 years, from -2.18 ± 0.72 Gt/yr (1953–2011/2015 average) to -4.43 ± 0.78 Gt/yr (2011–2015). Despite being spatially variable, a trend of increased thinning from NE towards SW is discovered, suggesting a link to the local gradient in temperature and precipitation. Ice loss is mostly focused on marine-terminating glaciers probably due to the interaction between glaciers and warming ocean water. These retreating glaciers generated a new island in 2016 and more islands are likely to emerge in the foreseeable future as FJL’s ice loss has reached an unprecedented rate. The research focus in the following chapter shifts to the neighboring archipelago called Severnaya Zemlya, Russia. A surge-like collapse initiated in 2013 in Vavilov Ice Cap, one of many ice caps in this region. By spring 2019, this ice cap had lost 9.5 Gt of ice. Using time series of surface elevation and glacier velocity derived from multiple satellite data sets such as WorldView (elevation), ArcticDEM (elevation), ASTER (elevation), Landsat 8 (velocity), Sentinel-1, (velocity), Sentinel-2 (velocity), Radarsat-2 (velocity), and ALOS-2 (velocity), I identify a shift of flow pattern starting in 2017 when shear margins formed within the grounded marine piedmont fan. Multiple summer speedups occurred after the new flow pattern formed, possibly with the aid of basal lubrication due to surface melt. With the analysis using multiple physical models, it is suggested that the collapsed ice cap has entered a new ice stream-like regime in which diffusion of surface thinning controls the glacier dynamics. This is the first documented case of an ice stream-like feature ever being formed, and this glacier now flows at a higher speed and drains the ice cap more efficiently. To publicize the findings and their scientific implications, I made two videos showing the temporal changes of the terminus position and speed pattern, which are available on Youtube. In the last chapter, I further develop a physical framework for the glacier perturbation model to understand how different glaciers respond to basal lubrication. The modified 1-D flowline model suggests two physical quantities, Péclet number (Pe) and a value dubbed J0, governing glacier vulnerability to basal lubrication. To test the model, I use the Ice Thickness Models Intercomparison eXperiment (ITMIX) data set and the NASA MEaSUREs ITS_LIVE data set. ITMIX contains velocity, elevation, and ice thickness data from Austfonna Ice Cap, Svalbard, where multiple glacier collapse events occurred within the past 10 years. I calculate Pe and |J0| using the data from ITMIX and compare them with the speed change revealed by the ITS_LIVE data set. The results show that a low Pe and a high |J0| correspond to the high magnitude of glacier speedup during 1995–2018, as suggested by the model prediction. My analysis implies that basal lubrication can lead to a prolonged or even permanent change of glacier dynamics for some glaciers. These “weak” glaciers might be able to waste ice more rapidly than we thought, posing a warning of an underestimated sea level rise projection.
Basal conditions directly control the glacier sliding rate and the dynamic discharge of ice. Recent glacier destabilization events indicate that some marine-terminating glaciers quickly respond to lubricated beds with increased flow speed, but the underlying physics, especially how this vulnerability relates to glacier geometry and flow characteristics, remains unclear. This paper presents a 1D physical framework for glacier dynamic vulnerability assuming sudden basal lubrication as an initial perturbation. In this new model, two quantities determine the scale and the areal extent of the subsequent thinning and acceleration after the bed is lubricated: Péclet number (Pe) and the product of glacier speed and thickness gradient (dubbed J0 in this study). To validate the model, this paper calculates Pe and J0 using multi-sourced data from 1996 to 1998 for outlet glaciers in the Greenland ice sheet and Austfonna ice cap, Svalbard, and compares the results with the glacier speed change during 1996/1998–2018. Glaciers with lower Pe and J0 are more likely to accelerate during this 20-year span than those with higher Pe and J0, which matches the model prediction. A combined factor of ice thickness, surface slope, and initial flow speed physically determines how much and how fast glaciers respond to lubricated beds in terms of speed, elevation, and terminus change.
A glacier can speed up when surface water reaches the glacier's bottom via crevasses and reduces sliding friction. This paper builds up a physical model and finds that thick and fast-flowing glaciers are sensitive to this friction disruption. The data from Greenland and Austfonna (Svalbard) glaciers over 20 years support the model prediction. To estimate the projected sea-level rise better, these sensitive glaciers should be frequently monitored for potential future instabilities.
Brain terrain (BT) is a type of midlatitude martian cryospheric feature consisting of complex ridges, generally believed to have formed through water ice sublimation. More recent studies propose, through comparison of Earth-bound analogs, that eolian processes may be the causation of these large-scale ridges as opposed to sublimation processes. There are two comprehensive classifications for brain terrain: open cell and closed cell, based solely on visually assessable characteristics. Closed cell brain terrain (CCBT) is characterized as having thick, tall (2-6m), widely spaced ridges. Open cell brain terrain (OCBT) presents hyper-sinuous, tendril-like ridges that are much shallower (0.5-1m) and closer together than CCBT. The primary topographical host for brain terrain is lineated valley fill (LVF) – ice rich flow features lining the mid-latitude channels of Mars – however, concentric crater fill and lobate debris aprons will commonly have brain terrain ridges present. [1,2] The relationship between lineated valley fill and the varying morphological types of brain terrain is not well understood.
In this study, we constrain the geomorphology and topography of brain terrain by presenting a detailed morphological analysis to limit possible formation theories. We analyze newly available HiRISE digital terrain models (DTMs) and associated orthoimages using ArcGIS and MATLAB.
Observations of ice flow velocity provide a key component for modeling glacier dynamics and mass balance. The feature tracking technique is one of the most commonly used methods for deriving ice flow velocity from remote sensing data. Despite being cost-effective compared to field measurements, running a feature tracking workflow is not easy because 1) searching for good data can be time-consuming; 2) fetching data can be challenging because the source images often have a large size; and, 3) there is no standardized pipeline for feature tracking processes.
Here we present an interactive, notebook-based interface that deploys the entire feature tracking workflow. This open-source tool aims to provide researchers, educators, and other users an easy way to perform glacier feature tracking.
In our demo notebook, we query data over Jakobshavn Isbræ, a large outlet glacier of the Greenland Ice Sheet with a history of seasonal flow speed variation. Users can choose to explore the readily available ITS_LIVE velocity or perform feature tracking using the Landsat 8 imagery. In this mini-study, We derive the spring speed change of Jakobshavn Isbræ during 2015-2021 (a few weeks before the EC meeting) using both ITS_LIVE and CARST-derived data, and find that the slowdown event at Jakobshavn in 2017/2018 seems to not last long. In 2021, Jakobshavn’s spring speed increases and likely reaches back to the peak between 2013 and 2016.
This demo notebook provide an easy and interactive way to deploy the entire feature tracking application. We expect to see it opens a way for researchers to explore new data, compare different algorithms, and visualize and validate their results. This tool also shows a full potential on education uses since it lowers the technical threshold for manipulating satellite data and deriving glacier speeds. The modules used by this demo notebook, including the GeoStacks and CARST packages, are open-source software and welcome community contributions.
Aseismic deformation has been suggested as a mechanism to release the accumulated strain in rifts. However, the fraction and the spatial distribution of the aseismic strain are poorly constrained during amagmatic episodes. Using Sentinel-1 interferograms, we identify the surface deformation associated with the 2014 Mw5.2 Karonga earthquake, Malawi, and perform inversions for fault geometry. We also analyze aftershocks and find a variety of source mechanisms within short timescales. A significant discrepancy in the earthquake depth determined by geodesy (3–6 km) and seismology (11–13 km) exists, although both methods indicate Mw5.2. We propose that the surface deformation is caused by aseismic slip from a shallow depth. This vertical partitioning from seismic to aseismic strain is accommodated by intersecting dilatational faults in the shallow upper crust and sedimentary basin, highlighting the importance of considering aseismic deformation in active tectonics and time-averaged strain patterns, even in rifts with little volcanism.
During the early stages of continental rifting, some accumulated tectonic energy is released with little or no earthquake activity (i.e., aseismic strain). This is most often observed in places where magma intrusion occurs. However, in rift basins lacking evidence of magma intrusion, how much and where the aseismic strain is released remains largely unknown. We investigate a magnitude 5.2 earthquake that occurred in 2014 near Karonga, Malawi, using both local seismic data and satellite ground deformation data. Our analyses show that although the main earthquake and other aftershocks ruptured at ∼12 km deep, the surface deformation is caused by an aseismic source from a shallower region (3–6 km deep). The aftershocks occur seconds to minutes apart and have different rupture sources, suggesting a highly damaged zone. The depth discrepancy between earthquake locations and the aseismic energy source might be caused by a weak, damaged layer where many faults intersect. Since intersecting faults are common in rift systems, our study suggests that this depth discrepancy might be common as well, indicating a large portion of energy released as aseismic strain in a continental rifting system.
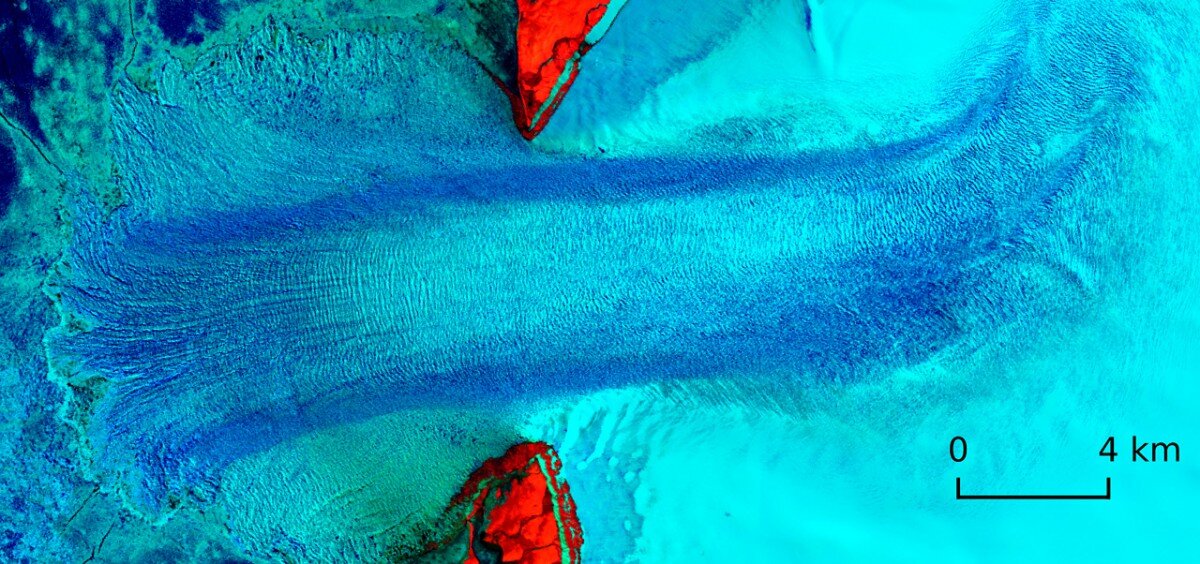
Surge-type glaciers typically undergo cyclical flow instability due to mass accumulation; however, some recent glacier surges have caused irreversible ice loss in a short period. At Vavilov Ice Cap, Russia, surge-like behavior initiated in 2013 and by spring 2019 the ice cap had lost 9.5 Gt of ice (11% mass of the entire basin). Using time series of surface elevation and glacier velocity derived from satellite optical and synthetic-aperture radar imagery, we identify a shift of flow pattern starting in 2017 when shear margins formed within the grounded marine piedmont fan. Multiple summer speedups correlate with warmer summers during 2015–2019 and suggest that surface melt may access the subglacial environment. Force balance analysis and examination of the Péclet number show that glacier thinning propagated upstream in 2016–2017, and diffusion became a significant dynamic response to thinning perturbations. Our results suggest that the glacier has entered a new ice stream-like regime.
A glacier surge is a sudden speedup of glacier flow coinciding with a large advance of the ice front. Some glaciers surge periodically every 10–100 years, and so surge mechanism is thought to be independent of climate change. However, some recent surges have evacuated so much ice that another surge is unlikely to occur in the same place again. A glacier surge at the Vavilov Ice Cap, Russia, is one of these cases. Since 2013, the glacier has drained more than 11% of the ice basin (9.5 Gt) into the ocean. After the initial surge in 2013, the glacier still retains fast flow at around 1.8 km/year, an unusually high and long-lasting speed for a glacier surge. To understand the future of the surge, we use satellite images to calculate surface elevations and ice speeds, and analyze their change over time for the glacier. The results reveal that the glacier now physically behaves more like an “ice stream,” a stream of fast-flowing ice within an ice sheet, which can probably flow at high speed for a long time and drain ice efficiently. This is the first documented case of an ice stream-like feature ever being formed.
In December, 2009, a rare sequence of earthquakes initiated within the weakly extended Western Rift of the East African Rift system in the Karonga province of northern Malawi, providing a unique opportunity to characterize active deformation associated with intrabasinal faults in an early-stage rift. We combine teleseismic and regional seismic recordings of the largest events, InSAR imagery of the primary sequence, and recordings of aftershocks from a temporary (4-month) local network of six seismometers to delineate the extent and geometry of faulting. The locations of ∼1900 aftershocks recorded between January and May 2010 are largely consistent with a west-dipping normal fault directly beneath Karonga as constrained by InSAR and CMT fault solutions. However, a substantial number of epicentres cluster in an east-dipping geometry in the central part of the study area, and additional west-dipping clusters can be discerned near the shore of Lake Malawi, particularly in the southern part of the study area. Given the extensive network of hanging wall faults mapped in the Karonga region on the surface and in seismic reflection images, the distribution of events is strongly suggestive of multiple faults interacting to produce the observed deformation, and the InSAR data permit this but do not require it. We propose that fault interaction contributed to the seismic moment release as a series of Mw 5-to-6 events instead of a normal main shock–aftershock sequence. We find the depth of fault slip during the main shocks constrained by InSAR peaks at less than 6 km, while the majority of recorded aftershocks are deeper than 6 km. This depth discrepancy appears to be robust and may be explained by fault interaction. Structural complexities associated with fault interaction may have limited the extent of coseismic slip during the main shocks, which increased stress deeper than the coseismic slip zone on the primary fault and synthetic faults to the east, causing the energetic aftershock series. There is no evidence of deformation at the Rungwe volcanic province ∼50 km north of the earthquake sequence between 2007 and 2010, consistent with previous interpretations of no significant magmatic contribution during the sequence.
Despite the strong geological evidence for episodic injection of magma over thousands of years, there are very few case studies where this process can be observed over short time scales (1–10 years). The 9 month long VEI 4 rhyolitic eruption of Cordón Caulle volcano in 2011–2012 was immediately followed by ∼1 m of uplift and constitutes a prime example of the episodic nature of magma injection over very short time scales.
In this study, we use InSAR time series to characterize a sequence of three transient pulses of ground uplift during March 2012 – May 2019. InSAR time series from COSMO-SkyMED, RADARSAT-2, Sentinel-1 and ALOS-2 detected ∼77 cm of exponential uplift during March 2012 – May 2015, ∼12 cm during July 2016 – February 2017 and ∼12 cm during May 2017 – May 2019. The three uplift episodes have very similar spatial wavelength and can be modeled with the same inflating sill at a depth of 6 km with a volume change of 0.17 km3, but their time evolution is different, from linear to exponential. Numerical models of a pressurized reservoir surrounded by a viscoelastic shell do not have a better fit than a magma injection model to the exponential signal recorded during 2012–2015, indicating that magma injection is the most likely mechanism to explain this uplift signal and that viscoelastic effects are negligible. The episodic time series of ground deformation can be explained by a coupled model of reservoir pressurization with magma flow in a conduit and variations of ∼5 MPa in the pressure of a deep magma source are enough to explain the transient signals observed in the time series. These magma injection pulses provide the heat to remobilize the crystal mush beneath the volcano on timescales of a few months, but the end of the uplift is not predicted by existing models. None of these uplift pulses were related to abnormal seismicity, and we speculate that they are mostly aseismic because they caused stresses of lower magnitude than the co-eruptive stresses. The meter scale displacement observed at Cordón Caulle between 2004 and 2019 suggests that the volcano undergoes episodic cycles of inflation like those observed in silicic calderas.
Ice caps that are mostly frozen at the bedrock-ice interface are thought to be stable and respond slowly to changes in climate. We use remote sensing to measure velocity and thickness changes that occur when the margin of the largely cold-based Vavilov Ice Cap in the Russian High Arctic advances over weak marine sediments. We show that cold-based to polythermal glacier systems with no previous history of surging may evolve with unexpected and unprecedented speed when their basal boundary conditions change, resulting in very large dynamic ice mass losses (an increase in annual mass loss by a factor of 100) over a few years. We question the future long-term stability of cold and polythermal polar ice caps, many of which terminate in marine waters as the climate becomes warmer and wetter in the polar regions.
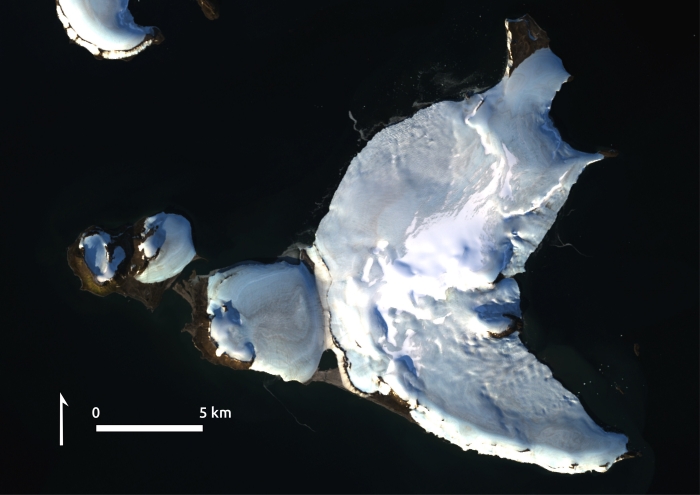
The glaciers of the Franz Josef Land (FJL) archipelago in the Russian Arctic are subjected to rapidly-warming temperatures but are small contributors to sea level. We analyze ice surface elevation data derived from satellite stereo imagery (WorldView and SPOT), radar altimetry (CryoSat-2), and a digitized 1953 cartographic map to calculate elevation change rates (dh/dt). Mass loss from FJL doubled between 2011 and 2015 compared to 1953–2011/2015, increasing from a rate of −2.18 ± 0.72 Gt/yr to −4.43 ± 0.78 Gt/yr. This 2011−2015 rate indicates an acceleration in ice loss from that observed in 2003–2009 by multiple studies using ICESat and GRACE. Glacier thinning rates are spatially highly variable. We observe glacier thinning rates of up to 10 m per year, and in general we see a trend of increased thinning from the NE towards the SW. Glacier retreat is widespread and has led to the creation of at least one new island. Historically, ice wastage from FJL is thought to have been relatively small, but accelerating ice loss may be the new normal for this archipelago in a warming Arctic.
The Malawi rift is part of the archetypal East African rift where early-stage crustal extension is dominated by faulting. In the Karonga region of northern Malawi, a sequence of earthquakes in late 2009, with 15 teleseismically detected (Mw 4.5-6.0) over 13 days, provides a uniqueopportunity to evaluate faulting processes controlling present-day extension in an early-stage rift. We describe observations of this sequence including hundreds of aftershocks located by a temporary seismic array installed in 2010, ground deformation from satellite interferograms, and surface rupture from field surveys published by others. We use all of these data to model fault geometry and slip. The aftershocks from January-May 2010 suggest the involvement of multiple faults, and we test the extent that this can be resolved by the InSAR data. The InSAR and surface rupture both suggest that the major slip occurred at shallow depth (less than 5 km). Our preferred aftershock locations appear to correlate with this principal slip zone, although uncertainty in the shallow velocity structure can allow for a bulk of the events to fall down-dip of the geodetically constrained slip. Subsequent deformation, including that associated with a December 2014 Mw 5.1 earthquake, can be constrained from multidisciplinary data collected during the SEGMeNT (Study of Extension and maGmatism in Malawi aNd Tanzania) project, which includes the Karonga region and spans 2013-2015. We find ~3 cm of potential ground movement at the location of the earthquake as determined by the SEGMeNT seismic array from Sentinel-1. Geodetic fault slip is consistent with the focal mechanism and depth determined by the local array. The location is at the northern end of the 2009-2010 aftershock zone, and aftershocks suggest some linkage with faults that slipped in 2009. InSAR observations do not provide any evidence for large aseismic slip or fluid movements during or after the 2014 sequence, which had less than 200 aftershocks above the network threshold. For example, we do not observe any deformation at Rungwe volcano above the ~2 cm/yr detection threshold with InSAR time series from ALOS (2007-2010) or Sentinel-1 (10/2014 - 04/2017). The time series from SEGMeNT and other continuous GPS stations do not show transients related to the earthquakes, but are not optimally located in space or time.
East Africa has been an important site for studying how continental plates break apart. We use different methods to study earthquakes and to map changes of Earth's surface, and to deduce their roles in plate tectonics. Our data is collected by satellites, and by temporary stations in Africa that were installed to monitor earthquakes and image the subsurface structure in the region. We combine them to find out how the surface breaks when earthquakes struck in 2009-2010 and 2014 around Lake Malawi (Nyasa), and its potential relationship to magmatic activity in the region of Rungwe.
Iapetus may be the most peculiar satellite in the Solar System. This Saturnian moon has a mean radius of 735 km, but an averagely 10-kilometer-high mountain ridge lies precisely on its 75% equatorial circumference. The ridge is so high that Iapetus appears walnut shaped, and it is named “equatorial ridge” after this amazing truth. The ridge was discovered by the Cassini spacecraft in 2005, but the formation theory is still under debate because of the lack of observational data. Several hypotheses, which are roughly divided into endogenic (tectonic buckling) and exogenic (ring remnant) processes, are attributed to explain its origin.
Previous studies also noted that the shape of Iapetus is an oblate spheroid related to a hydrostatic spin period of 16 h, but Iapetus now is tidally synchronized with a 79-day period. Because the surface of Iapetus is old and heavily cratered, the formation of the ridge and the oblate spheroid had finished in the early stage of Iapetus (> 4000 Ma). Thus, it’s plausible to assume that Iapetus had a high thermal flux when the equatorial ridge formed. The assumption leads to a result that the surface would bend when the applying load like the ridge exerted. Therefore, upon calculating the deflection of the surface, we could obtain some constraints for the thermal history of Iapetus, and the proper origin model of the equatorial ridge.
According to this idea, we attempted to construct analytical and numerical flexural models of the equatorial ridge by utilizing elastic lithosphere theory. The equatorial ridge is treated as a perfectly linear load on Iapetus’ hard shell (i.e. elastic layer of Iapetus). The Digital Terrain Model (DTM) data are inputted and transformed to a vertical load function, and also reveals that large deflection exists in some foothills area. This few-kilometre deflection implies a very thin elastic layer enough to regard it as a flat plate. Moreover, there are no tectonic signals on Iapetus, so the flat-Earth and one-plate condition could adapt to the flexure model. To obtain an analytical solution, the equatorial ridge is simplified to a central loading point. This can be rearranged into an explicit deflecting function in the 1-D coordinate system, so the deflection can be computed if the elastic thickness is given. In the numerical model, the point vertical force is replaced by a loading map. The finite difference method is used to solve the ODE flexural function. Consider the elastic thickness may vary with different areas; we also set a variable-thickness program for the numerical modelling.
The modelling results illustrate that an over 100-km elastic layer would not cause any significant deflection; it coincides with the previous suggested. However, a deflecting curve with a range of 5-10 km elastic thickness well fits the terrain data, especially for the distance between a bulge and the ridge. Numerical solution also shows that there are 2 factors contributing the geomorphological changes: cratering and the flexure. Cratering created a deep hole and a thinner elastic layer. These new results seem controversial to the previous studies, but the modelled surface profile is highly consistent with numerical ridge DTM profile except the plateau regions which are suspected to be caused by cratering end load pressure. Such a thin shell implies that the ridge formed when the heat flux stayed high (~18 mWm-2). Therefore, the formation of the ridge probably happened before the despin (oblate shaping) event. The thin-layer flexure model also solves the problem of the angle of response because the ridge sank in the deflected surface, lowered the slope from the angle of response to the observed slope of the ridge. Since there is no evidence relating to endogenic processes, the exogenic origin is in favour.
In conclusion, the flexural model of Iapetus’ equatorial ridge reveals the possibility of thinner (5-10 km) hard shell, fits the surface profile and thermal history, and supplies more clues to the origin of Iapetus, the interesting satellite in the Solar System.
.
.
.
.
.
.
.
.
.
R3-230, Center for Space and Remote Sensing Research, National Central University, 300 Zhongda Rd., Zhongli District, Taoyuan City 320317, Taiwan